Predictors of Altruistic Behaviour among a Sample of Emerging Adults at the United States International University in Africa
Rose Nabi Deborah Karimi Muthuri
DOI10.21767/2471-7975.100035
Department of Psychology, United States International University in Africa (USIU-A), Nairobi, Kenya
- *Corresponding Author:
- Rose Nabi Deborah Karimi Muthuri
Department of Psychology
United States International University in Africa (USIUA)
P.O. Box 14634-00800, Nairobi, Kenya
Tel: +254791489924
E-mail: nabideborah18@gmail.com
Received date: August 8, 2018; Accepted date: August 10, 2018; Published date: August 13, 2018
Citation: Muthuri RNDK (2018) Predictors of Altruistic Behavior among Sample of Emerging adults at the United States International University in Africa. Ann of Behave Sci Vol.4 No.2:4.. doi:10.21767/2471-7975.100035
Abstract
Background: Altruistic behaviour also known as helping behaviour is characterized by self-sacrificing actions done to benefit or contribute to the welfare of others. Behavioural trends related to altruism change throughout the developmental life span; following the development of more complex cognitive processes. The purpose of this study was to assess predictors of altruistic behaviour among a sample of emerging adults at the United States International University (USIU-A).
Methods: This study was conducted among a sample size (n)=141: 51% of participants were female and 49% male. The instrument used in the current study was the Self- Reported Altruism scale (SRA). Multivariate regression analysis was carried out to assess predictors of altruism using SPSS® (Version 20).
Findings: The research findings report that among emerging adults’ altruistic behavioural trends were predicted by majorly age, presences of religion, and group size. However, gender, number of siblings, year of study and participants school were not statistically significant predictors of altruism among emerging adults. Furthermore, 71% of emerging adults suggested that socialization can be used to create awareness of altruism and its significance in society.
Conclusion: Altruism in emerging adulthood increases positively as individuals’ grow from age 18 years to 25 years. Gender related stereotypes on altruism should be diminished as they do not influence self-reported altruism among emerging adults. Creation of awareness through social agents or actors will contribute greatly to nurturing altruism among emerging adults.
Keywords: Altruistic behaviour; Emerging adults; Young adults; Helping behavior; Prosocial behavior
https://betsatgirisi.com https://bettilte.com https://vegabete.com https://kanyongiris.com https://matgiris.com https://celtabetegiris.com https://hilbetegiris.com https://melbete.com https://kinbettinge.com https://wipbett.com https://pusulabetegiris.com https://superbahiss.com https://lidyagiris.com https://holiganbete.com https://1xbetgiriss.com https://asyabahise.com https://jetbahise.com https://betdoksana.com https://betebetle.com https://betgramagiris.com
Keywords
Altruistic behaviour; Emerging adults; Young adults; Helping behavior; Prosocial behavior
Introduction
Altruistic behaviour refers to the actions an individual performs selflessly for the benefit of another’s’ welfare, with no anticipation of social return [1-3]. Altruism is a pro-social behavior that is believed to be part of human nature [4]. The Hobbesian and Rousseau notions explain motivations for behaving altruistically [5]. The Hobbesian notion explains that altruistic behaviour is based on selfish desires [5]. For instance, an individual will help others with expectations such as social status or for appraisal. On the other hand, the Rousseau’s notion supports the ideology that altruistic behaviour is driven by an intrinsic selfless nature of human beings [5]. In relation to the two beliefs other researchers have found two types of altruists namely: pure altruist and warm-glow altruist [2].
The goal of a pure altruist is to help others in order to feel good about themselves; while a warm-glow altruist aims to help others solely to increase the welfare of the receiver [2]. The receiver of the altruistic act has also been researched on. In 2016, a study found individuals appreciated altruistic behaviour that are experiential in nature such as holiday trips, having a meal together and concerts; rather than materialistic in nature for example cars, jewellery, houses [6]. The appreciation of altruism can be explained through a developmental angle.
Altruistic behaviour and perceptions change throughout the humans’ life span from simple to more complex cognitive processes [1]. Human beings have a general tendency to help from the age of 1 year and 8 months [7]. Between age 5 to 12 years, altruistic act such as sharing and caring, are taught through socialization specifically in school and at home [1]. During the adolescent stage (aged 13-19 years), pro-social tendencies have been found to increase [1]. Altruistic behaviour in school is nurtured through cooperative programs and games such as sports teams, group science fairs and achieving collective rewards [1].
Younger adults (20 to 34 years) have the lowest empathetic concern compared to middle adults and older adults who have the greatest empathetic concern [8]. In 2014, Freund and Blanchard-Fields similarly discovered young adults are less willing to spend their resources compared to middle aged adults [2]. Researchers believed this was because younger adults have fewer accumulated resources and opportunities compared to middle and older adults [2]. Research has found that older adults are more likely to be sympathetic and empathetic and willing to help than younger adults [8]. Adults in the middle-age and old-age stages gain a sense of purpose from volunteering which results in improvement of their wellbeing [9]. This is concurrent with Erik Erikson’s psychosocial theory, where generativity begins at middle adulthood (ages 40-65 years). It is essential to nurture altruism in human interaction.
Socialization is a reinforcing factor that can be used to nurture altruism among emerging adults [10]. The social actors include: parents, teachers, role models religious groups and culture in general [11]. The more awareness or knowledge individuals have of societal human rights, the more they are encouraged to behave in a prosocial manner [1]. As they are also aimed at eliminating antisocial behavioral tendencies. In addition, a combined exposure to religious and moral based texts [12] and elevating media [13] positively influence altruistic behaviour can be used to cultivate altruism among individuals. As they have been found to heighten emotions such as tenderness, compassion and caring; however, this was for a short period [12,13]. Thus, a hybrid of both could lead to the development of altruistic personality among individuals. Nurturing altruism in society is essential as it introduces some benefits.
There are interpersonal and intrapersonal benefits of altruistic behaviour [14]. Benefits of altruistic behaviour in society benefit both the performer and receiver of the altruistic act [14-16]. A benefit of altruism is the increased social opportunity in which people can freely engage with other people [14]. Furthermore, individuals who engage in altruistic behaviour often receive benefits such as improved mental health, physical health, emotional stability plus emotional satisfaction and life satisfaction [9,15]. Receivers of unexpected altruistic acts gain psychological benefits such as; being more open minded, helpful, grateful, spiritual and increased motivation to help others [16].
Elimination of the ideology of gender based altruism through increased awareness can result in an increased occurrence of altruistic behaviour in our society. Seefeldt found that extravagant and large altruistic acts were perceived to be performed by males; while minute altruistic acts were perceived to be done by female [17]. The social reputation of a female is highly determined [18] by their altruistic behavior and is obligated to be more altruistic than males [19]. Thus in order to eliminate the gender stereotypes, the relationship between gender and altruism needs to be studied.
The purpose of this study was to explore predictors of altruistic behaviour among emerging adults. Studies among emerging adults (18 to 25-year-old individuals’) are increasing as it is a recent developmental age group concept [20]. Prior studies have found various factors to influence the altruism such as type of relationship, the consequence of the altruistic acts, elevating media, moral judgment, age, religiosity, social distance and gender [21]. The current study proved the significance of altruistic behaviour among emerging adults specifically, the predictors that can be used to encourage altruism among emerging adults.
Methods
The study location and sample
The current study was carried out at the United States International University-Africa (USIU-A) located in Nairobi, Kenya. The participants in the study (n=141), which was 2.11% of the total USIU-A student population of (n=6668) [22]. The sample (n=141) comprised of 51% female and 49% male emerging adults.
For the current study, the sampling method used was the multistage cluster sampling. Stage one involved selecting all the four schools in USIU-A including: The Chandaria School of Business, the School of Humanities and Social Sciences, the School of Science and Technology and the School of Pharmacy and Health Sciences. Stage two involved selection of one department from all the four schools mentioned. Specifically, numbers were randomly assigned to each department within the four schools. Followed by the selection of a specific department within the school using the random number tables.
Stage three of the sampling procedure involved identifying courses under the randomly selected departments under the schools. The courses that were randomly selected were insession during the summer semester 2017. The selection of the courses was done using random number tables. Finally, the participants of the study were the students registered in the undergraduate program courses aged between 18-25 years.
The instrument
The Self-Report Altruism Scale (SRA) was the data collection tool used in this study. The SRA was administered through face-to-face administration. The SRA required participants to state the frequency of performing 20 altruistic behaviours through the Likert scale that comprises of five categories “Never”, “Once”, “More than once”, “Often”, or “Very often” [23]. In 1981, Rushton et al. found the internal consistency of the 20-item of the Self-Report Altruism Scale is (α=0.89, n=416) [23]. The predictive validity of the SRA was found to be r= +0.40; which is an average positive correlation coefficient [23]. In addition, to the 20 items in the SRA was demographic characteristics and also an open ended question on how to encourage altruism among emerging adults.
The regression multivariate logistic models
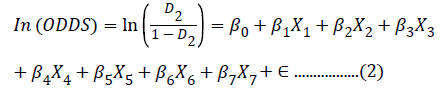
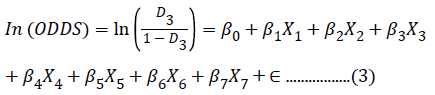
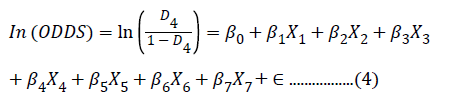
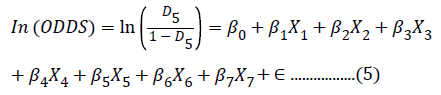
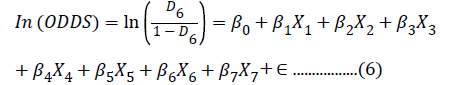
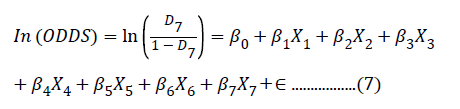
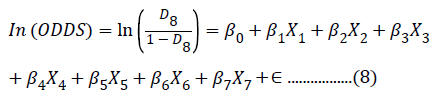
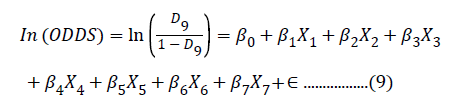
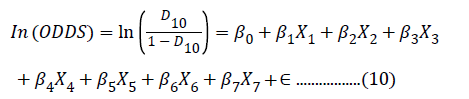
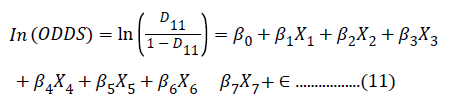
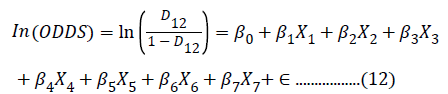
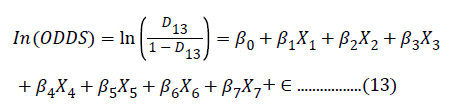
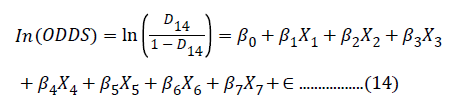
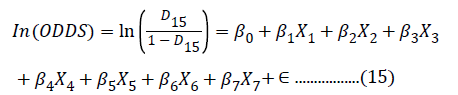
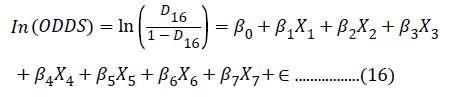
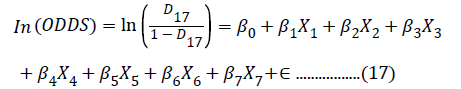
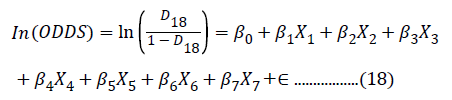
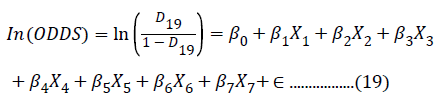
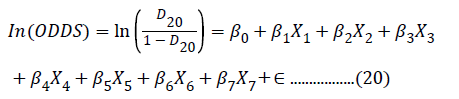
Multivariate regression logistic models for twenty equations are shown and explained below. The models illustrate the odds of a respondent behaving altruistically for separate altruistic acts. The results based on the models for each altruistic act, examines each predictor of altruistic behaviour among the sample of emerging adults in the current study.
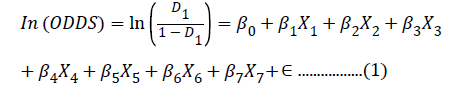
Where
1. D1 is a dummy variable referring to whether jth respondent helped push a stranger’s car that was broken down or out of gas or not. The expected value of D1 continues to be P, the probability that jth respondent will make the choice described by D1=1 (the jth respondent demonstrates altruistic behaviour). The dependent variable in equation 1 can be thought of as the logarithm of the odds that the jth respondent will demonstrate the specific form of altruistic behaviour.
2. β is the slope coefficient for gender; is the slope coefficient for age; is slope coefficient for the number of people; is slope coefficient of religious belief; is slope coefficient number of siblings; is slope coefficient year of study; is slope coefficient participant school.
3. X1, X2, X3, X4, X5, X6and X7 are described in Table 1.
| Variables | Independent Variable Description |
|---|---|
| X1: Gender | 0=Male; 1=Female |
| X2: Age (Emerging adults: 18-25 years) | Years |
| X3: Group size | The number people of present in the last altruistic act performed by the respondent. |
| X4: Religious belief | 0=no religious belief; 1=presence of a religious belief. |
| X5: Number of siblings | The number of respondents’ brothers and sisters in their nuclear families. |
| X6: Year of study | Raw: 1=freshman; 2=sophomore; 3=junior; 4=senior. Recoded: 0 if 1 or 2; 1 if 3 or 4. |
| X7: Participants school | The respondents school: 0 if business or science and technology; 1= humanities or health sciences |
Table 1:
The meanings of the dependent variables and independent variables are as described in the earlier subsection (Table 1).
Data analysis
The data collected in the present study, was analyzed using the Statistical Package for Social Sciences (SPSS version 20.0). The multivariate regressions and frequencies and percentages were computed using SPSS. The data analysis was used to demonstrate the association between 20 altruistic acts and various factors. In addition, the analysis also illustrated the ways of encouraging altruistic behaviour among emerging adults.
Ethical considerations
Ethical considerations for the present study included: informed consent, confidentiality, anonymity, voluntary participation, reassurance that participants will not be harmed physically, psychologically or emotionally following participation in the current study.
To ensure the welfare and ethical considerations were appropriate for the study; the study was reviewed and approved by the Institutional Review Board (IRB) in the United States International University Africa (USIU-A).
Results
Multivariate regression results
Table 2 shows the estimated multivariate binary logit model regression results for equation 1; where the dependent variable is “I have helped push a stranger’s car that was broken down or out of gas” and the seven (7) independent variables include: gender, age, group size, year of study, number of siblings, presence of religious belief and participant’s school. The estimation of equation 1 output also gives us the element “Exp (B)” in the last column of Table 2.
| Results for Equation 1 | |||||
|---|---|---|---|---|---|
| Independent variables | β | S.E. | T value (β /S.E) |
Sig. | Exp (β) |
| Gender | -2.065 | 0.491 | 4.21* | 0.000 | 0.127 |
| Group size | 0.193 | 0.483 | 0.40 | 0.689 | 1.213 |
| Year of study | -0.547 | 0.716 | 0.76 | 0.445 | 0.579 |
| Age | 0.372 | 0.130 | 2.86* | 0.004 | 1.450 |
| Number of siblings | 0.099 | 0.112 | 0.88 | 0.375 | 1.104 |
| Presence of Religious belief | 1.250 | 0.770 | 1.62** | 0.104 | 3.492 |
| Participant’s school | -0.556 | 0.514 | 1.08 | 0.280 | 0.574 |
Table 2: Estimated multivariate regression results for Equation 1.
This element is the odds ratio predicted by the model. It was computed by raising the base of the natural logarithm to the βth power, where β is the slope from logistic regression Equation 1. For example, for gender variable “Exp (B)”=0.127, implying that the model predicts that the odds of the respondent having helped push a stranger’s car that was broken down or out of gas, are 0.127 times higher for men than they are for women. The Cox and Snell R square was 32.4%, implying that the seven independent variables explained 32.4% of the variations in the logarithm of odds that the respondent helped push a stranger’s car when broken down or out of gas.
The coefficients for gender, year of study and participant’s school had negative signs. The other coefficients for group size, age, number siblings and presence of religious belief had positive signs. The independent variables that were statistically significant included gender and age at 95% level of confidence and the presence of religious belief was statistically significant at 90% level of confidence.
The coefficients for group size, year of study, number of siblings and participant’s school were not statistically significant. The estimation of the multivariate logistic model in equation 2 did not yield any results because there was no variation in the dependent variable. In other words, all the respondents answered affirmatively to the statement “I have given directions to a stranger.”
Table 3 presents the estimated multivariate binary logit model regression results for equation 23; where the dependent variable is “I have made money change for a stranger” and the seven (7) independent variables included: Gender, age, group size, year of study, number of siblings, presence of religious belief and participant’s school. Cox and Snell R square for equation 3 was 2.7%, implying that the seven independent variables explained 2.7% of the variations in the logarithm of odds that the respondent made money change for a stranger.
| Results for Equation 3 | |||||
|---|---|---|---|---|---|
| Independent Variables | β | S.E. | T value (β /S.E) | Sig. | Exp (β) |
| Gender | 0.244 | 0.468 | 0.52 | 0.602 | 1.276 |
| Group size | -0.567 | 0.438 | 1.29 | 0.195 | 0.567 |
| Year of study | -0.746 | 0.619 | 1.21 | 0.228 | 0.474 |
| Age | 0.104 | 0.118 | 0.88 | 0.380 | 1.109 |
| Number of siblings | -0.028 | 0.088 | 0.32 | 0.753 | 0.973 |
| Presence of Religious belief | -0.042 | 0.715 | 0.06 | 0.953 | 0.959 |
| Participant’s school | 0.084 | 0.482 | 0.17 | 0.861 | 1.088 |
Table 3: Estimated multivariate regression results for Equation 3.
In Table 3, the coefficients for gender, age, and participant’s school had positive signs. The coefficients for group size, year of study, number of siblings and presence of religious belief had negative signs for this particular equation the coefficient for group size. All other six independent variable coefficients were significantly different from zero at either 95% or 90% levels of confidence.
Table 4 shows the estimated multivariate binary logit model regression results for equation 4; where the dependent variable is “I have given money to a charity” and the seven (7) independent variables are gender, age, group size, year of study, number of siblings, presence of religious belief and participant’s school. Cox & Snell R square for equation 4 was 2%, that the seven independent variables explained 2% of the variations in the logarithm of odds that the respondent gave money to a charity.
| Results for Equation 4 | |||||
|---|---|---|---|---|---|
| Independent variables | Β | S.E. | T value (β /S.E) | Sig. | Exp (β) |
| Gender | -0.987 | 0.848 | 1.16 | 0.244 | 0.373 |
| Group size | -0.379 | 0.774 | 0.49 | 0.625 | 0.685 |
| Year of study | 0.319 | 1.199 | 0.27 | 0.790 | 1.375 |
| Age | -0.023 | 0.199 | 0.12 | 0.910 | 0.978 |
| Number of siblings | -0.100 | 0.131 | 0.76 | 0.443 | 0.905 |
| Presence of Religious belief | 0.750 | 1.145 | 0.66 | .0513 | 2.117 |
| Participant’s school | 0.720 | 0.848 | 0.85 | 0.396 | 2.054 |
Table 4: Estimated multivariate regression results for Equation 4.
The coefficients for year of study, presence of religious belief and participant’s school had positive signs. While the coefficients for gender, age, group size, and number of siblings had negative signs (Table 4). For this particular dependent variable, all the seven independent variable coefficients were found not to be significantly different from zero at 95% and 90% levels of confidence.
Table 5 shows the estimated multivariate binary logit model regression results for equation 5; where the dependent variable is “I have given money to a stranger who needed it”. The seven independent variables include: gender, group size, age, number of siblings, presence of religious belief and participant’s school. Cox and Snell R square for equation 5 was 6.5%, suggesting that the seven independent variables explained 6.5% of the variations in the logarithm of odds that the respondent gave money to a stranger who needed it. The coefficients for gender, year of study, age and number of siblings had positive signs. On the other hand, the coefficients for group size, presence of religious belief and participant’s school had negative signs.
| Results for Equation 5 | |||||
|---|---|---|---|---|---|
| Independent variables | β | S.E. | T value (β /S.E) | Sig. | Exp (β) |
| Gender | 0.601 | 0.546 | 1.10 | 0.271 | 1.824 |
| Group size | -0.610 | 0.503 | 1.21 | 0.225 | 0.543 |
| Year of study | 0.003 | 0.896 | 0.00 | 0.997 | 1.003 |
| Age | 0.370 | 0.166 | 2.23* | 0.026 | 1.447 |
| Number of siblings | 0.066 | 0.120 | 0.55 | 0.582 | 1.068 |
| Presence of Religious belief | -0.107 | 0.832 | 0.13 | 0.898 | 0.899 |
| Participant’s school | -0.221 | 0.554 | 0.40 | 0.690 | 0.802 |
Table 5: Estimated multivariate regression results for Equation 5.
The only independent variable coefficient that was statistically significantly different from zero of respondents at 95% level of confidence (Table 5). The other six independent variables coefficients namely: gender, year of study, group size, number of siblings, presence of religious belief and participant’s school were not significantly different from zero at 95% or 90% level of confidence.
Table 6 shows the estimated multivariate binary logit model regression results for equation 6; where the dependent variable is “I have donated goods or clothes to a charity” and the seven (7) independent variables include: gender, age, group size, year of study, number of siblings, presence of religious belief and participant’s school. Cox & Snell R square for equation 6 was 4.6%, indicating that the seven independent variables explained 4.6% of the variations in the logarithm of odds that the respondent donated goods or clothes to a charity. The coefficients for gender, age, number of siblings and participant’s school had positive signs. While coefficients for group size, year of study, and presence of religious belief had negative signs (Table 6).
| Results for Equation 6 | |||||
|---|---|---|---|---|---|
| Independent variables | β | S.E. | T value (β /S.E) | Sig. | Exp (β) |
| Gender | 0.219 | 0.913 | 0.24 | 0.811 | 1.244 |
| Group size | -0.311 | 0.817 | 0.38 | 0.703 | 0.732 |
| Year of study | -0.434 | 1.037 | 0.42 | 0.676 | 0.648 |
| Age | 0.002 | 0.215 | 0.00 | 0.992 | 1.002 |
| Number of siblings | 0.518 | 0.317 | 1.63** | 0.102 | 1.679 |
| Presence of Religious belief | -1.245 | 1.433 | 0.87 | 0.385 | 0.288 |
| Participant’s school | 0.875 | 1.061 | 0.82 | 0.409 | 2.399 |
Table 6: Estimated multivariate regression results for Equation 6.
The coefficient for number of siblings was statistically significant at 90% level of confidence. The coefficients for gender, group size, year of study, age, presence of religious belief and participant’s school were not significantly different from zero at either 95% or 90% level of confidence.
Table 7 shows the estimated multivariate binary logit model regression results for equation 7; where the dependent variable is “I have done volunteer work for a charity” and the seven (7) independent variables include: gender, age, group size, number of siblings, presence of religious belief and participant’s school. Cox & Snell R square for equation 7 was 12.8%, indicating that the seven independent variables explained 12.8% of the variations in the logarithm of odds that the respondent volunteered to work for a charity.
| Results for Equation 7 | |||||
|---|---|---|---|---|---|
| Independent variables | β | S.E. | T value (β /S.E) | Sig. | Exp (β) |
| Gender | -0.308 | 0.490 | 0.63 | 0.530 | 0.735 |
| Group size | 0.993 | 0.522 | 1.90* | 0.057 | 2.701 |
| Year of study | -1.999 | 0.704 | 2.84* | 0.005 | 0.135 |
| Age | 0.333 | 0.141 | 2.36* | 0.018 | 1.395 |
| Number of siblings | 0.085 | 0.111 | 0.77 | 0.447 | 1.088 |
| Presence of Religious belief | 0.148 | 0.794 | 0.19 | 0.852 | 1.159 |
| Participant’s school | -0.062 | 0.486 | 0.13 | 0.898 | 0.940 |
Table 7: Estimated multivariate regression results for Equation 7.
Table 7 shows the coefficients for group size, age, number of siblings and presence of religious belief had positive signs. While coefficients for gender, year of study, and participant’s school had negative signs (Table 7).
In addition, at 95% level of confidence the independent variables coefficients that were statistically significant included age, group size and the year of study. The coefficients for gender, number of siblings, presence of religious belief and participant’s school were not significantly different from zero at their 95% or 90% level of confidence (Tables 8-20.)
| Results for Equation 8 | ||||||
|---|---|---|---|---|---|---|
| Independent variables | β | S.E. | T value (β /S.E) | Sig. | Exp (β) | |
| Gender | -0.485 | 0.470 | 1.03 | 0.301 | 0.616 | |
| Group size | 0.922 | 0.417 | 2.21* | 0.027 | 2.514 | |
| Year of study | 0.005 | 0.654 | 0.007 | 0.994 | 1.005 | |
| Age | -0.139 | 0.117 | 1.19 | 0.236 | 0.870 | |
| Number of siblings | 0.038 | 0.084 | 0.45 | 0.652 | 1.039 | |
| Presence of Religious belief | 0.629 | 0.852 | 0.74 | 0.460 | 1.877 | |
| Participant’s school | 0.447 | 0.463 | 0.97 | 0.335 | 1.563 | |
Table 8: Estimated multivariate regression results for Equation 8.
| Results for Equation 9 | |||||
|---|---|---|---|---|---|
| Independent variables | β | S.E. | T value (β /S.E) | Sig. | Exp (β) |
| Gender | -0.041 | 0.487 | 0.08 | 0.932 | 0.960 |
| Group size | 0.050 | 0.470 | 0.11 | 0.916 | 1.051 |
| Year of study | 0.062 | 0.761 | 0.08 | 0.935 | 1.064 |
| Age | 0.250 | 0.140 | 1.79* | 0.073 | 1.285 |
| Number of siblings | 0.046 | 0.105 | 0.44 | 0.659 | 1.047 |
| Presence of Religious belief | 0.876 | 0.742 | 1.18 | 0.238 | 2.401 |
| Participant’s school | -0.316 | 0.493 | 0.64 | 0.521 | 0.729 |
Table 9: Estimated multivariate regression results for Equation 9.
| Results for Equation 10 | |||||
|---|---|---|---|---|---|
| Independent variables | β | S.E. | T value (β /S.E) | Sig. | Exp (β) |
| Gender | 0.204 | 0.516 | 0.39 | 0.692 | 1.227 |
| Group size | -1.452 | 0.474 | 3.06* | 0.002 | 0.234 |
| Year of study | -0.075 | 0.787 | 0.09 | 0.924 | 0.928 |
| Age | 0.373 | 0.150 | 2.49* | 0.013 | 1.451 |
| Number of siblings | -0.080 | 0.090 | 0.89 | 0.371 | 0.923 |
| Presence of Religious belief | 1.501 | 0.760 | 1.98* | 0.048 | 4.487 |
| Participant’s school | -0.375 | 0.517 | 0.73 | 0.468 | 0.687 |
Table 10: Estimated multivariate regression results for Equation 10
| Results for Equation 11 | |||||
|---|---|---|---|---|---|
| Independent variables | β | S.E. | T value (β /S.E) | Sig. | Exp (β) |
| Gender | 0.893 | 0.646 | 1.38** | 0.167 | 2.443 |
| Group size | 1.049 | 0.705 | 1.49** | 0.137 | 2.854 |
| Year of study | 19.524 | 8666.530 | 0.002 | 0.998 | 301409278.365 |
| Age | 0.048 | 0.158 | 0.30 | 0.761 | 1.049 |
| Number of siblings | -0.099 | 0.100 | 0.99 | 0.322 | 0.906 |
| Presence of Religious belief | 1.600 | 0.928 | 1.72* | 0.085 | 4.951 |
| Participant’s school | -1.418 | 0.684 | 2.07* | 0.038 | 0.242 |
Table 11: Estimated multivariate regression results for Equation 11.
| Results for Equation 12 | |||||
|---|---|---|---|---|---|
| Independent variables | β | S.E. | T value (β /S.E) | Sig. | Exp (β) |
| Gender | -1.052 | 0.516 | 2.04* | 0.042 | 0.349 |
| Group size | -0.336 | 0.492 | 0.68 | 0.494 | 0.714 |
| Year of study | -0.632 | 0.661 | 0.96 | 0.339 | 0.532 |
| Age | 0.302 | 0.117 | 2.58* | 0.010 | 1.353 |
| Number of siblings | 0.059 | 0.088 | 0.67 | 0.503 | 1.061 |
| Presence of Religious belief | 0.666 | 0.826 | 0.81 | 0.420 | 1.946 |
| Participant’s school | 0.033 | 0.527 | 0.06 | 0.951 | 1.033 |
Table 12: Estimated multivariate regression results for Equation 12.
| Results for Equation 13 | |||||
|---|---|---|---|---|---|
| Independent variables | β | S.E. | T value (β /S.E) | Sig. | Exp (β) |
| Gender | -0.234 | 0.485 | 0.48 | 0.630 | 0.791 |
| Group size | 0.849 | 0.519 | 1.64** | 0.102 | 2.338 |
| Year of study | -0.769 | 0.668 | 1.15 | 0.250 | 0.463 |
| Age | 0.187 | 0.129 | 1.45** | 0.148 | 1.205 |
| Number of siblings | -0.122 | 0.090 | 1.36** | 0.176 | 0.885 |
| Presence of Religious belief | 1.636 | 0.767 | 2.13* | 0.033 | 5.136 |
| Participant’s school | -0.198 | 0.484 | 0.41 | 0.682 | 0.820 |
Table 13: Estimated multivariate regression results for Equation 13.
| Results for Equation 14 | |||||
|---|---|---|---|---|---|
| Independent variables | Β | S.E. | T value (β /S.E) | Sig. | Exp (β) |
| Gender | 0.897 | 0.521 | 1.72* | 0.085 | 2.452 |
| Group size | -0.431 | 0.471 | 0.92 | 0.360 | 0.650 |
| Year of study | 0.358 | 0.866 | 0.41 | 0.679 | 1.431 |
| Age | 0.350 | 0.147 | 2.38 | 0.017 | 1.419 |
| Number of siblings | 0.083 | 0.112 | 0.74 | 0.456 | 1.087 |
| Presence of Religious belief | 0.583 | 0.751 | 0.78 | 0.438 | 1.791 |
| Participant’s school | -0.987 | 0.525 | 1.88* | 0.060 | 0.373 |
Table 14: Estimated multivariate regression results for Equation 14.
| Results for Equation 15 | |||||
|---|---|---|---|---|---|
| Independent variables | β | S.E. | T value (β /S.E) | Sig. | Exp (β) |
| Gender | 0.435 | 0.498 | 0.87 | 0.383 | 1.544 |
| Group size | -0.421 | 0.467 | 0.90 | 0.367 | 0.656 |
| Year of study | -0.584 | 0.731 | 0.79 | 0.425 | 0.558 |
| Age | 0.385 | 0.150 | 2.57* | 0.010 | 1.470 |
| Number of siblings | -0.055 | 0.090 | 0.61 | 0.538 | 0.946 |
| Presence of Religious belief | 1.412 | 0.734 | 1.92* | 0.055 | 4.103 |
| Participant’s school | -0.721 | 0.501 | 1.44** | 0.150 | 0.486 |
Table 15: Estimated multivariate regression results for Equation 15.
| Results for Equation 16 | |||||
|---|---|---|---|---|---|
| Independent variables | β | S.E. | T value (β /S.E) | Sig. | Exp (β) |
| Gender | 0.859 | 1.011 | 0.85 | 0.395 | 2.362 |
| Group size | 0.787 | 1.143 | 0.69 | 0.491 | 2.197 |
| Year of study | 17.713 | 8624.520 | 0.002 | 0.998 | 49254494.463 |
| Age | 0.312 | 0.305 | 1.02 | 0.307 | 1.366 |
| Number of siblings | -0.045 | 0.173 | 0.26 | 0.797 | 0.956 |
| Presence of Religious belief | 1.785 | 1.317 | 1.36** | 0.175 | 5.962 |
| Participant’s school | -1.110 | 1.080 | 1.03 | 0.304 | 0.330 |
Table 16: Estimated multivariate regression results for Equation 16.
| Results for Equation 17 | ||||||
|---|---|---|---|---|---|---|
| Independent variables | β | S.E. | T value (β /S.E) | Sig. | Exp (β) | |
| Gender | 0.517 | 0.458 | 1.13 | 0.259 | 1.677 | |
| Group size | 0.914 | 0.494 | 1.85* | 0.064 | 2.494 | |
| Year of study | 0.438 | 0.657 | 0.67 | 0.505 | 1.550 | |
| Age | 0.035 | 0.115 | 0.30 | 0.757 | 1.036 | |
| Number of siblings | -0.180 | 0.101 | 1.78* | 0.076 | 0.836 | |
| Presence of Religious belief | 1.276 | 0.719 | 1.77* | 0.076 | 3.583 | |
| Participant’s school | 0.123 | 0.471 | 0.26 | 0.794 | 1.131 | |
Table 17: Estimated multivariate regression results for Equation 17.
| Results for Equation 18 | |||||
|---|---|---|---|---|---|
| Independent variables | β | S.E. | T value (β/S.E) | Sig. | Exp (β) |
| Gender | -0.829 | 0.655 | 1.27 | 0.206 | 0.436 |
| Group size | 1.800 | 1.069 | 1.68* | 0.092 | 6.047 |
| Year of study | -0.389 | 0.985 | 0.39 | 0.693 | 0.677 |
| Age | 0.367 | 0.215 | 1.71* | 0.089 | 1.443 |
| Number of siblings | -0.035 | 0.123 | 0.28 | 0.777 | 0.966 |
| Presence of Religious belief | 0.612 | 0.947 | 0.65 | 0.518 | 1.844 |
| Participant’s school | 0.646 | 0.663 | 0.97 | 0.330 | 1.908 |
Table 18: Estimated multivariate regression results for Equation 18.
| Results for Equation 19 | |||||
|---|---|---|---|---|---|
| Independent variables | β | S.E. | T value (β/S.E) | Sig. | Exp (β) |
| Gender | -0.827 | 0.470 | 1.76* | 0.079 | 0.437 |
| Group size | 0.178 | 0.447 | 0.39 | 0.690 | 1.195 |
| Year of study | -0.430 | 0.671 | 0.64 | 0.522 | 0.651 |
| Age | 0.213 | 0.122 | 1.75* | 0.081 | 1.238 |
| Number of siblings | 0.175 | 0.128 | 1.37** | 0.173 | 1.191 |
| Presence of Religious belief | 0.459 | 0.710 | 0.65 | 0.518 | 1.582 |
| Participant’s school | -0.170 | 0.470 | 0.36 | 0.718 | 0.844 |
Table 19: Estimated multivariate regression results for Equation 19.
| Results for Equation 20 | |||||
|---|---|---|---|---|---|
| Independent variables | β | S.E. | T value (β /S.E) | Sig. | Exp (β) |
| Gender | -0.147 | 0.722 | 0.20 | 0.838 | 0.863 |
| Group size | -0.985 | 0.595 | 1.66* | 0.098 | 0.373 |
| Year of study | -0.022 | 0.918 | 0.02 | 0.981 | 0.978 |
| Age | -0.046 | 0.158 | 0.29 | 0.771 | 0.955 |
| Number of siblings | 0.027 | 0.146 | 0.18 | 0.852 | 1.028 |
| Presence of Religious belief | 1.432 | 0.913 | 1.57** | 0.117 | 4.187 |
| Participant’s school | -0.546 | 0.735 | 0.74 | 0.457 | 0.579 |
Table 20: Estimated multivariate regression results for Equation 20.
The ways of encouraging altruistic behavior
The respondents gave various suggestions of ways of encouraging altruistic behaviour among emerging adults. Approximately 70% of the respondents suggested that creating awareness through socialization, teaching, workshops and advertising are some ways altruism among emerging adults can be encourages. The use of incentives was essential as a way of fostering altruistic behaviour according to 17.6% of the participants. Empathy or encouragement of being empathetic was also suggested in the current study by about 6% of the participants as a way of encouraging altruism. About 3.4% of the participants’ suggested, encouraging self-initiative among emerging adults and also increasing the security and safety in the country were other possible methods of inspiring emerging adults to behave altruistically.
Discussion
Altruism is an element of prosocial behaviour that involves individuals’ engaging in actions that benefit the welfare of other individuals, with no expectations of social return [3-5]. Benefits of altruism are evident in both the performer and receiver, of the altruistic action [16,21]. The current study done among emerging adults found that both individual and situational determinants collectively influenced altruistic behaviour similar to other research studies [24,25].
For the current study, gender which is an individual determinant of altruism; was found to influence three equations namely 1, 12 and 19 which represented 15% of the altruistic acts. In the remaining 85% (17/20) of the equations gender was not statistically different from zero at 95% level of confidence. The latter suggest that both male and female participants had no significant differences in their performance frequency of 85% of the altruistic behaviors in the self-report altruism scale (SRA). This contradicts the results of a recent study that agreed with the stereotypical view that women are more altruistic than males due to socialization [26].
Conversely, researchers have found gender differences in altruistic behaviour; men were more generous than women in helping situations [27]. In addition, a study done in 2015 found that women were more generous compared to males [28]. Both studies found results that are contrary to the ones from the current study; that found minimal differences in altruism among emerging adults [27,28]. This may be a result of cultural influences which has been found to directly influence altruistic behaviour [29].
As an individual develops prosocial tendencies have been found to increase [1]. This is consistent with the current study finding that age is an influential factor of altruistic behaviour across the sexes. In the present study, coefficients for age had positive signs and were statistically significant for 9 equations/ items at 95% level of confidence. Thus implying that even among emerging adults aged between 18 to 25 years there was an increase in altruistic behaviour as the participants age increased. The reason for this is that preparedness to help in various contexts such as loss; pain and injustice have been found to be age-related [8].
The group size is a situational determinant of altruistic behaviour [24]. The coefficients for group size were found to be statistically significant at 95% level of confidence in six equations. Thus, implying for both the male and female emerging adult participants, 30% of the altruistic acts are influenced by the group size. This may be due to the emotional benefits presented in being altruistic [9]. Therefore, suggesting that the larger the group size present, the more likely an individual is to behave altruistically.
Religiosity has been found to encourage a humane approach of treating others [12]. Religious belief in the current study was found to be statistically significant at 95% level of confidence for six equations (approximately 30% of the altruistic acts in the SRA). This shows that for emerging adults, the presence of religious belief increases the odds of altruistic behaviour tendencies, regardless of the gender of the individual. This was consistent with a study that found religiosity and altruism had a high positive correlation among undergraduate students [12].
In the regression analysis, the participant’s school was statistically significant at 95% level of confidence in 2 equations. This means that participants school (either Chandaria school of business, School of health sciences, School of humanities and social sciences or the School of Science and technology) influenced only 10% of the altruistic behaviors in the SRA. Therefore, the participants school as a situational determinant is not a major factor that influences altruistic behaviour. The coefficient for the independent variable year of study was statistically significant in 1 equation at 95% level of confidence. The junior and senior students were more likely to volunteer to work for a charity compared to freshmen and sophomore students in this study.
The coefficient for number of siblings was found to be statistically significant at 95% level of confidence in only 1 equation. This suggests that the more siblings one has the more likely an individual would volunteer to look after or play with a neighbours’ pet or children without being paid. However, for the remaining 95% of the altruistic acts, the number of siblings was not statistically different from zero for the current study.
Socialization is a reinforcing factor of altruism [10]. Through socialization awareness on altruistic behaviour can be created. Through socialization individuals are more likely to empathize with other individuals, especially when they are aware of societal human rights [1]. Social actors such as parents, teachers, religious groups, media, mentors, trainers, life coaches, and culture provide a chance for modeling of altruistic behaviour [16]. Through social actors the benefits of altruistic behaviour can be are noticeable to emerging adults. According to Zhao, elevating media was found to heighten emotions such as compassion and generosity which made people behave more altruistically [12].
Reinforcing altruistic behaviour can be done through the use incentives such as verbal appraisal, rewards and enlightening people on the wellness benefits. Verbal appraisal, increased interpersonal and intrapersonal benefits, a more secure and free society, psychological benefits, activation of brain regions associated with socialization and emotion, increased physical well-being are some benefits that have been found to be effective in encouraging altruistic behaviour [14,16,30].
Being empathetic was suggested by 6% of the respondents as a method of increasing altruistic behaviour. Empathy is often brought about by awareness, thus enabling an individual to “put themselves in the other persons’ shoes”. This is concurrent with the empathy-altruistic theory that explains that humans have the innate desire to help others [25]. Nonetheless, freedom of choice is essential for altruistic behaviour [14]. This implies that an individual has freewill to choose whether to help or not to help and should not be forced; that way an individual can be satisfied [14]. Therefore, if we let it be self-initiative emerging adults may be encouraged to behave altruistically as suggested by respondents in the current study.
Having a more secure and safe country creates an enabling environment for prosocial behavior such as altruism. One of the respondents (054) stated, “I think people are concerned about their safely before helping others because they are a lot of people who look like thus need help but have bad intentions e.g. fraud”. This implies that insecurity and lack of safety can discourage people from behaving altruistically. This is concurrent with a study that found, the more security and sensitization of societal human rights the more motivated individuals were to behave in a prosocial manner [1].
Limitation of the Study
The present study due to limited time and money was done using a relatively small sample size of emerging adults. Therefore, the results are not representative or generalizable to the entire population of emerging adults in USIU-A.
The tool used to collect data the SRA was developed in the United States for western cultures but has been applied to the Australian, European and Asian continents. Therefore, critics may argue that the SRA was not suitable for an African context. Nevertheless, the reader should note that the SRA was used as there was no other instrument developed on altruistic behaviour for the African context at the time of the study. All the same, the participants of the study when asked did not indicate that the items were irrelevant.
This study conveys self-reported data from the self-reported altruism scale (SRA) thus may be a potential source of bias. Therefore, using triangulation method such as focus groups and interviews may have reduced chances of any bias and given a chance to study non-verbal responses.
Conclusion
The present study found that development influences altruistic perceptions and behaviors among emerging adults. Furthermore, significant predictors of altruism included religious belief and group size. The present study, confirmed that the gender stereotypical view of altruism is not present in all populations such as the emerging adults in the current study. While the minor factors that either influenced one or two altruistic acts were: year of study, number of siblings and participant school. Socialization is a major tool that can be utilized to create of awareness about the benefits of altruistic behaviour in our society more prosocial behavior can be nurtured. Therefore, further studies should examine the influence of age, group size and religious belief on altruistic behaviour on a larger scope.
References
- Toumbourou JW (2016) Beneficial action within altruistic and prosocial behavior. Review of General Psychology 20 (3): 245-258.
- Freund AM, Blanchard-Fields F (2014) Age-related differences in altruism across adulthood: Making personal financial gain versus contributing to the public good. Dev Psychol 50 (4): 1125-1136.
- Li R, Jiang T, Yong J, Zhou H (2018) College students’ interpersonal relationship and empathy level predict internet altruistic behavior—Empathy level and online social support as mediators. Psychol Behav Sci 7 (1): 1-7.
- Hoffman ML (1981) Is altruism part of human nature? J Pers Soc Psychol 40 (1): 121-137.
- Clement F, Harris P, Benard S, Antoinietti JP, Kaufman L (2014) Rousseau’s child: Preschool expects strangers to favor prosocial actions. J Pers 73 (2): 105-110.
- Walker J, Kumar A, Gilovich T (2016) Cultivating gratitude and giving through experiential consumption. Emotion. Advance Online Publication.
- Warneken F, Tomasello M (2014) Extrinsic rewards undermine altruistic tendencies in 20-month-olds. Dev Psychol 44 (6):1785-1788.
- Sze JA, Gyurak A, Goodkind MS, Levenson RW (2012) Greater emotional empathy and prosocial behaviour in late life. Emotion 12 (5): 1129-1140.
- Fechter l (2016) Altruism and well-being. Honors senior thesis projects. p: 93.
- Szuster A (2016) Crucial dimensions of human altruism. affective vs. conceptual factors leading to helping or reinforcing others. Front Psychol 2: 1.
- Farsides T (2007) The psychology of altruism. The Psychologist 20 (8): 474-477.
- Zhao L (2012). Exploring religiosity’s effects on altruistic behavior. Social Research Report (In press) 1: 1-14.
- Ellithorpe ME, Ewoldsen DR, Oliver MB (2015) Elevation (sometimes) increases altruism: choice and number of outcomes in elevating media effects. Psychol Pop Media Cult 4 (3): 236-250.
- Seglow J (2002) Altruism and freedom. Critical review of social and political philosophy. 5 (4): 145-163.
- Barasch A, Levine EE, Berman JZ, Small DA (2014) selfish or selfless? On the signal value of emotion in altruistic behavior. J Pers Soc Psychol 107 (3): 393-413.
- Hoffman E, Gonzalez-Mujica J, Acosta-Orozco C, Compton WC (2017) The psychological benefits of receiving real-life altruism. J Humanistic Psychol 1: 2-5.
- See-Feldt LD (2008) Gender stereotypes associated with altruistic acts. UW-Stout Journal of Student Research 2: 7.
- Heilman ME, Chen JJ (2005) Same behaviour, different consequences: reactions to men’s and women’s altruistic citizenship behaviour. J Applied Psychol 90 (3): 431-441.
- Zarbantany L, Hartmann DP, Gelfand DM, Vinciguerra P (1985) Gender differences in altruistic reputation: are the art factual? Dev Psychol 21 (1): 97-101.
- Arnett JJ (2000) Emerging adulthood: A theory of development from the late teen through early twenties. American Psychological Association 55 (5): 469-480.
- Impett EA, Gable SL, Peplau LA (2005) Giving up and giving in: the costs and benefits of daily sacrifice in intimate relationships. J Pers Soc Psychol 89 (3): 327-344.
- United States International University Africa (2017) (USIU-A): Summer 2017 fact sheet. Nairobi: USIU-A; 2017.
- Rushton JP, Chrisjohn RD, Fekken GC (1981) The altruistic personality and the self-report altruism scale. Person Individual Differences 2: 293-302.
- Wolfson SL (1978) Individual and situational determinants of altruism and helping behaviour. Durham Theses.
- Batson CB, Duncan BD, Ackerman P, Buckley T, Birch K (1981) Is empathic emotion a source of altruistic motivation? J Pers Soc Psychol 40 (2): 290-302.
- Rand DG, Brescoll VL, Everett JA, Capraro V, Barcelo H (2016) Social heuristics and social roles: intuition favors altruism for women but not for men. J Exp Psychol Gen 145 (4): 389-396.
- Bethlehem RA, Allison C, Andel EM, Coles AI, Neil K, et al. (2016) Does empathy predict altruism in the wild? Soc Neurosci 2: 1-8.
- Zin G, Escobal G, Esteves G, Goyos C (2015) Sharing game: Influence of gender, cost of response, history of reinforcement, and amount of money in the resource distribution of undergraduate students. Behaviour Analysis: Research and Practice 15 (1): 65-80.
- Jeffries V (1998) Virtue and the altruistic personality. Sociological Perspectives 41 (1): 151-166.
- Weng HY, Fox AS, Shackman AJ, Stodola DE, Caldwell JZ, et al. (2013) Compassion training alters altruism and neural responses to suffering. Psychol Sci 24 (7): 1171-1180.
Open Access Journals
- Aquaculture & Veterinary Science
- Chemistry & Chemical Sciences
- Clinical Sciences
- Engineering
- General Science
- Genetics & Molecular Biology
- Health Care & Nursing
- Immunology & Microbiology
- Materials Science
- Mathematics & Physics
- Medical Sciences
- Neurology & Psychiatry
- Oncology & Cancer Science
- Pharmaceutical Sciences